Innovative
SaaS product
for analytics
SaaS product
for analytics
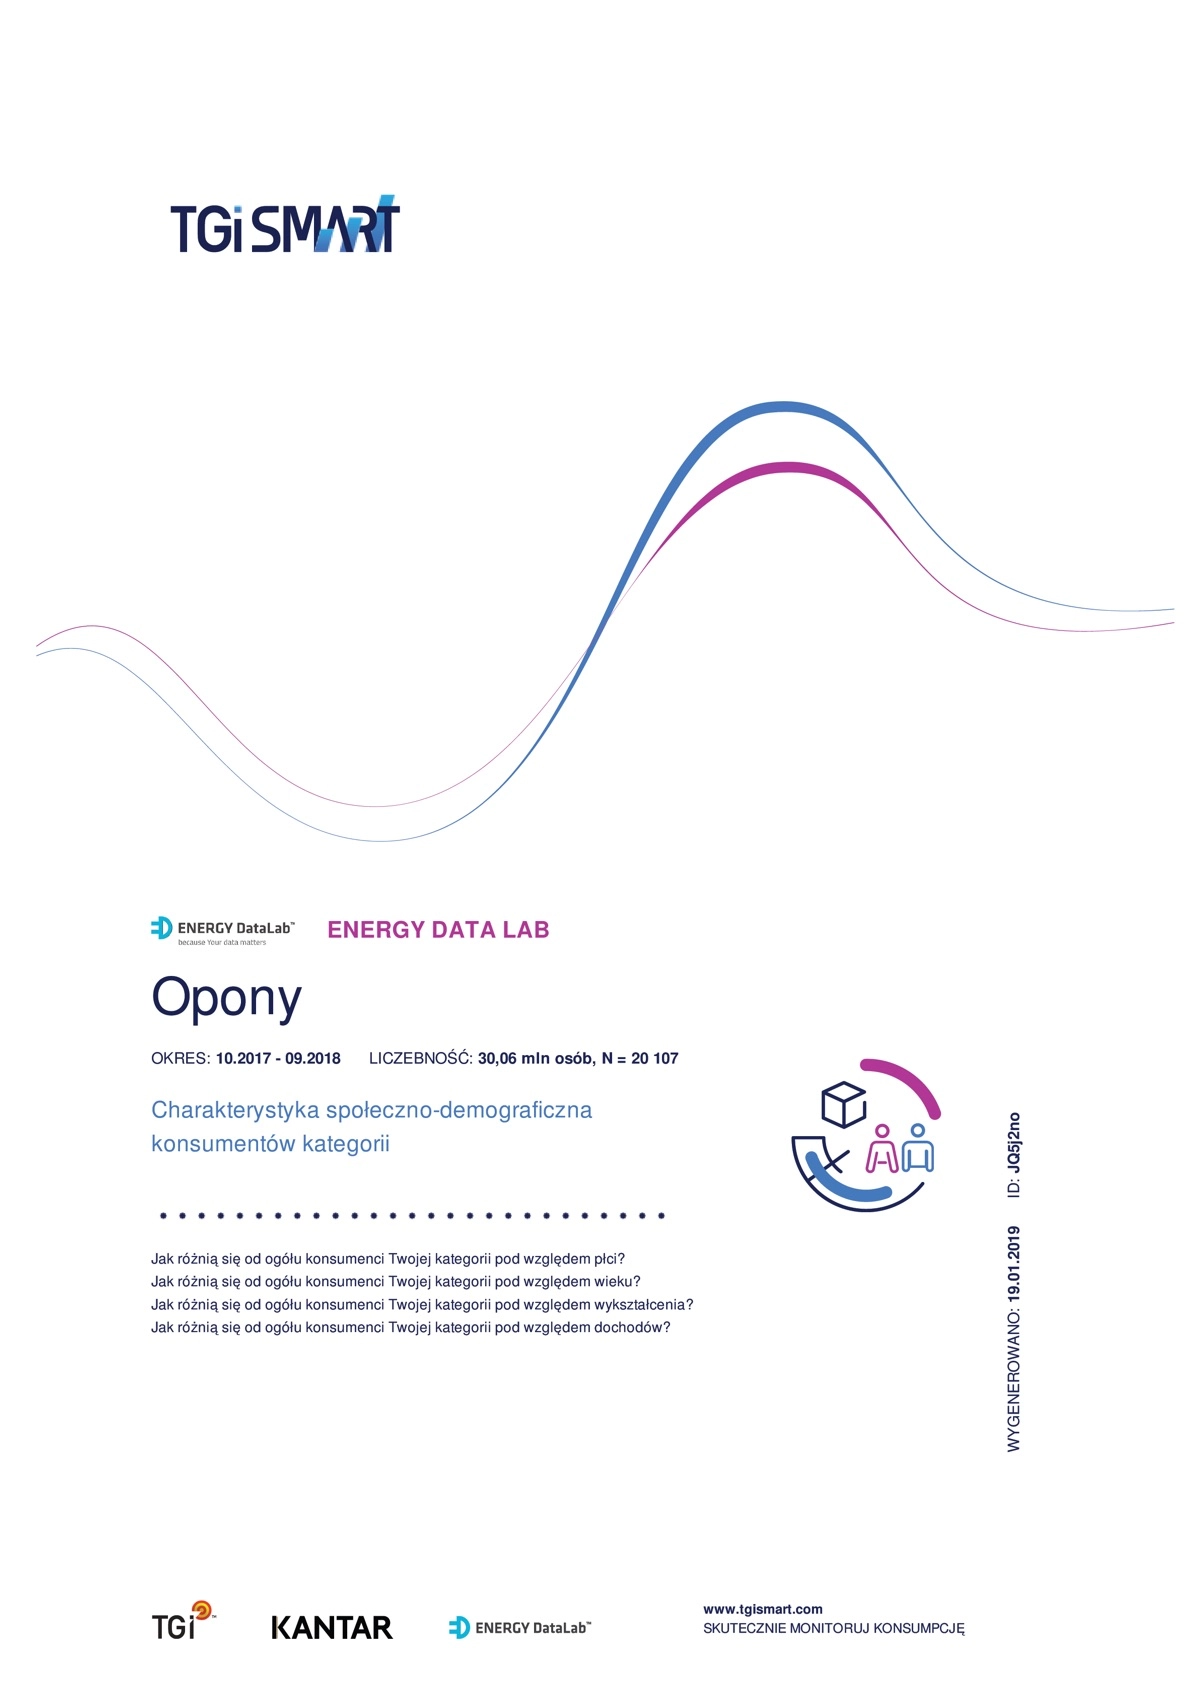
Interactive tool for analysis and visualisation TGI research data on consumption of goods, services, media and lifestyle

Partnership


Interactive tool for analysis and visualisation TGI research data on consumption of goods, services, media and lifestyle
To enable specialists or companies planning marketing activities to quickly and clearly analyze research data from selected product categories and brands.
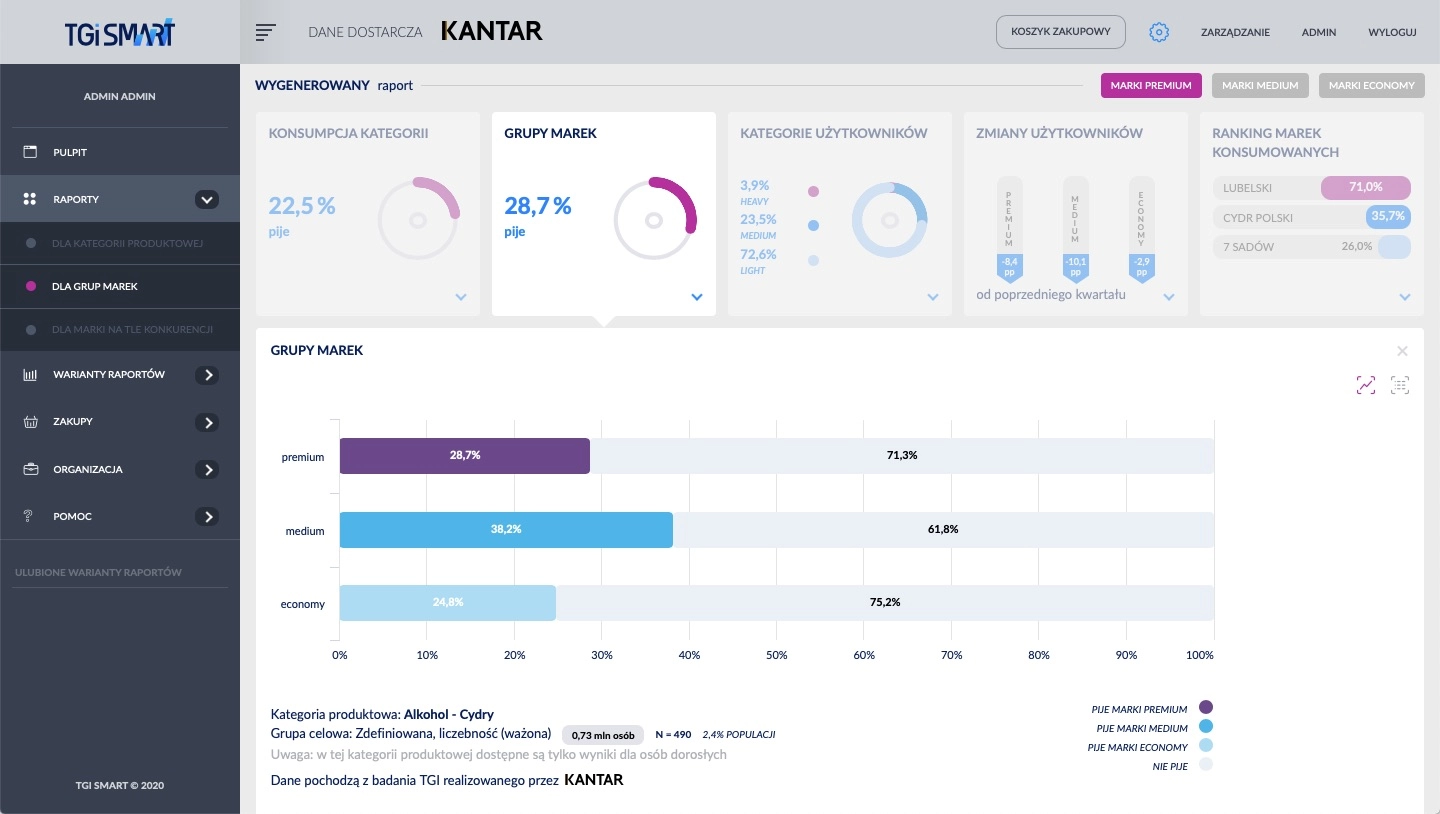
A web platform offering interactive, personalized dashboards and real-time data analysis in both subscription (SaaS) and one-time access models.

The product's brand originated from the name of TGI (Target Group Index) research report which is used as the main data source in the product. The 'smart' suffix highlights product's modernity and innovation in providing easy access to consumers behavior analyses. The project included all aspects of brand creation process - from choosing name to designing platform's user interface.
The platform was created using cutting-edge technologies. The chosen architecture and technology stack guaranteed high performance and scalability of the solution and allowed to further development. Additionally, to ensure high scalability and security of the platform we utilize Amazon Web Services.
Kantar is one of the global leaders specialising in data, knowledge and consultancy. It operates in the entire spectrum of research disciplines and consultancy, and its specialised organisations employing 30 k people deliver inspiring knowledge and formulate business strategies for corporations and public institutions in 100 countries. Kantar is a member of Bain and WPP capital group, and its services are used by over half the companies from the Fortune Top 500 list.
A crucial part of product's visual identity with a subtle reference to charts.
One of analyses presented on a bar chart.
A top section including a video presentation of the platform.